

Feature
A free ETF screener for repeatable research
Register for 12 months of free access to Buydy's ETF screener. Filter US-listed funds by expense ratio, AUM, yield, holdings, and other available fields, save a shortlist, and add percentile context in the ETF heat map.
Why workflows beat one-off screens
One-off screens answer today's curiosity; workflows answer tomorrow's triage. Buydy orients around scheduled refreshes and stable symbols so you compare like-with-like across sessions. Save filters between visits, rebuild the same universe each week, and track what changed, without exporting CSVs that go stale overnight.
Fund fields as a shared language for ETF research
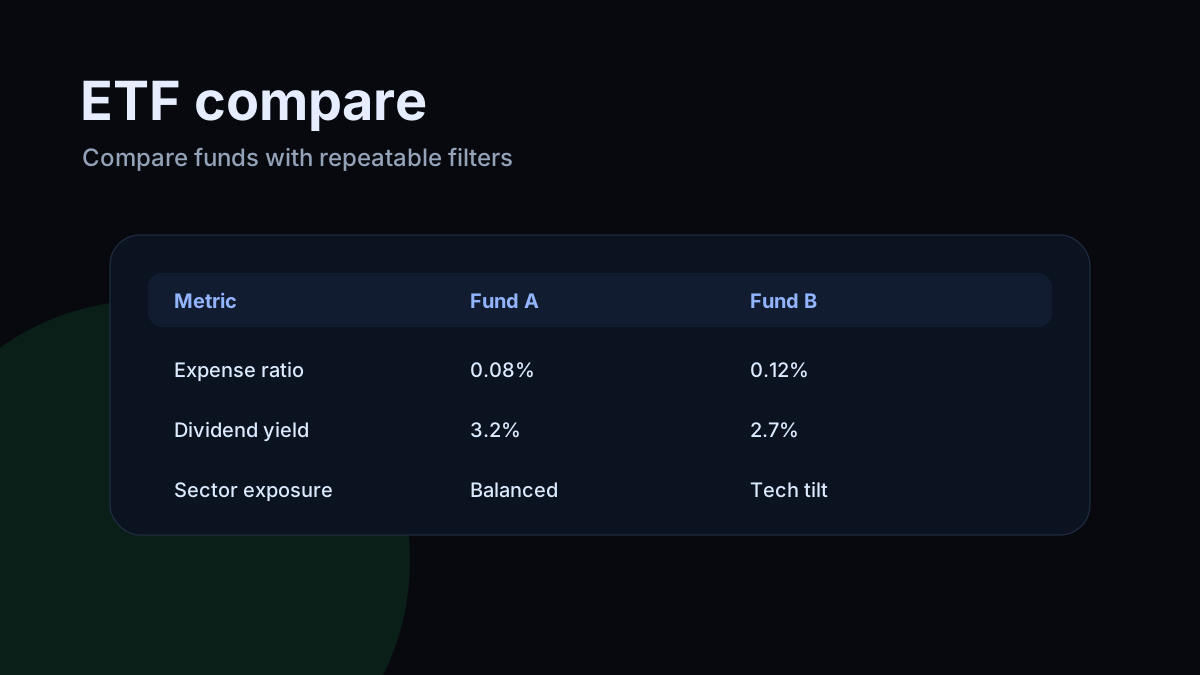
Relative context helps you agree on what deserves attention first. For US-listed ETF tables, compare expense ratio, AUM, yield, and holdings fields in the screener. Then rank finalists in the live ETF heat map with label peer percentiles. Pair fund shortlists with the stock heat map on underlying equities when you want sector or industry percentile context on top holdings.
From shortlist to decision with honest data
After filtering, open individual names to verify source metrics, dividend history, and valuation context. Buydy does not invent fallbacks when data is thin, blank cells mean insufficient source data, not a hidden estimate.
A calm weekly cadence
Most members do not need a new screener every day. They need the same filters and a short list of what changed. Save the universe you care about, revisit it on a schedule, and use digests when you are away from the dashboard. Pair ETF screening with the stock heat map on top holdings when you want equity percentile context, and with global indexes when macro context should come first.
FAQ
- Does Buydy replace my broker?
- No. Buydy focuses on research workflows: screening, heat maps, and dashboards. Execution stays with your broker.
- Where should I start with the ETF screener?
- Begin with a familiar universe. Apply two or three filters that match your mandate, then compare expense ratio, AUM, yield, and holdings on your shortlist before opening fund detail or researching top holdings on the stock heat map.
- Can I combine ETF screening with heat maps?
- Yes, as a three-step workflow. Filter ETFs in the screener, rank finalists in the ETF heat map with label peer percentiles, then research underlying equities on the stock heat map when you need sector or industry context. ETF symbols do not appear on the stock heat map.
- Is Buydy's ETF screener free?
- Every new registered user gets 12 months of full Buydy access at no charge, including the ETF screener, ETF heat map, stock heat map, global indexes, and research digests. No credit card is required.